
2025 Annual Market Research
Every year, we look at the data behind our pay scales, the markets we are watching, and the trends that shaped compensation for Athletic Trainers in the regions we staff. And we publish what we find.
This is the 2025 edition, informing the pay decisions we are carrying into 2026.
We do this work for the same reason we’ve always done it. Knowing your worth is part of your job. Making sure you are paid like the licensed healthcare professional you are is part of ours.
State of the US Economy in 2025
2025 was the year the labor market kept softening. Job openings fell from roughly 7.5 million at the start of the year to about 6.5 million by December, the lowest level we have seen since 2020. Unemployment ticked up alongside that decline, climbing from 4.0% in January to 4.6% by November. The pendulum that swung hard in workers' favor in 2022 and 2023, when openings outpaced unemployed persons by nearly two to one, has settled into something closer to balance, with the slight edge moving back toward employers.
Cost-of-living adjustments moderated alongside that shift. The 2025 national COLA came in at 2.5%, down from the 3.2% adjustment we reported in last year's blog and well below the 5%+ range we were navigating in 2023. For employers, that means smaller automatic raises baked into existing budgets. For ATs, it means the gap between what compensation should be and what is being offered is more visible than ever, which is exactly why we keep publishing this data.
How We Approach the Research
We conduct ongoing market research across the regions we staff, layering public market data from Indeed, Glassdoor, and Salary.com against profession-specific benchmarks from the NATA Salary Survey, with reference points from Go4Ellis and Indiana State University data.
This year, we expanded the regions we report on. California (NorCal, Los Angeles, Inland Empire, and San Diego) remains the core. Arizona (Mesa/Tempe) and Pennsylvania (Pittsburgh and Philadelphia) are now included to reflect the markets we have grown into.
We also made a deliberate change to how we present the data. Going forward, we are separating ongoing employment (FT/PT) from per diem and event-based work. Both matter, but they are not the same thing. Combining them in a single benchmark distorts the picture of what an Athletic Trainer can actually expect to earn in a stable, ongoing role or what they should be advocating for outside of that role.
Compensation Structure: Why We Separate the Two
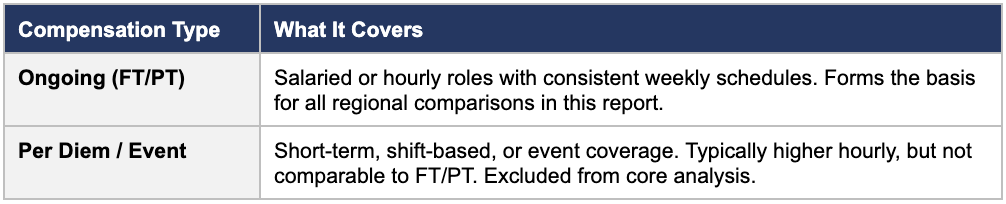
Per diem rates often look higher on paper because they are designed to. They compensate for the absence of guaranteed hours, benefits, share risk, and long-term income stability. When per diem and FT/PT data get blended, the average creeps up, expectations for ongoing roles get distorted, and ATs end up benchmarking salary conversations against numbers that were never meant to apply.
We have seen this play out in practice. An AT walks into a salary negotiation citing a per diem hourly figure they saw published somewhere, and the employer comes back with a market rate for ongoing work, and the conversation falls apart. Both sides were looking at real data. Neither was looking at the same kind. In an effort to better support that conversation happening more constructively, we made clear distinctions between the two work types.
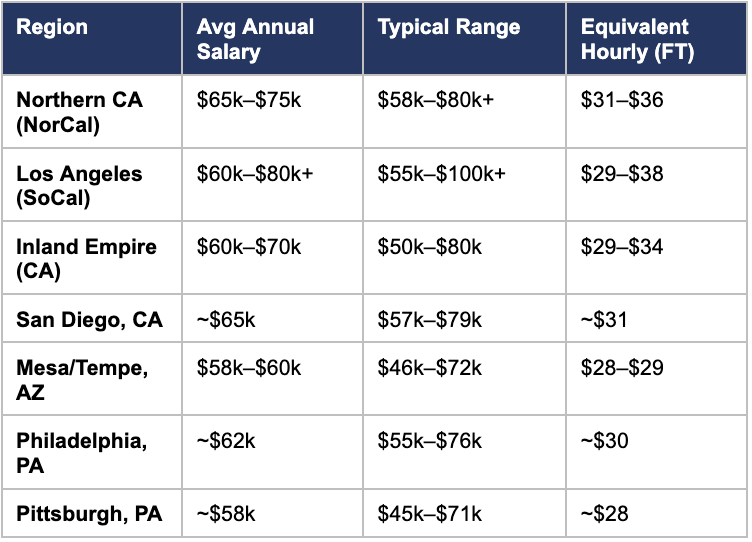
Regional Compensation Overview (Ongoing FT/PT Roles Only)
The table below reflects ongoing employment compensation only. Hourly figures are FT equivalents converted from full-time salaries using the standard 2,080 hours per year (40 hours per week × 52 weeks). They are not per diem or event rates.
Industry Benchmark
The most recent NATA Salary Survey data places the national average for full-time, BOC-certified Athletic Trainers at approximately $68,900 per year, or about $33 per hour at FT equivalent. That number sits cleanly within the midpoint of the regional ranges in our dataset, which tells us two things: our regional research is directionally accurate, and public job boards are likely understating true compensation in some markets, particularly in California and Philadelphia.
When we publish a pay range that sits at or above the NATA national average, that is not an accident. It is a deliberate decision to use the most credible profession-specific benchmark we have, and to build from there.
Per Diem and Event-Based Work, In Context
We are not ignoring per diem work. It earns its own section here, with its own context, because it does not belong inside a benchmark built for ongoing roles.
Where data is available (primarily through event-based listings), per diem rates currently fall in the range of approximately $35 to $60 per hour in the same regions listed above. Rates can exceed that for last-minute coverage, specialized events, and high-demand regions in California and the Northeast.
What those rates do not include:
Guaranteed hours
Employer-provided benefits
Long-term income stability
Shared risk of patient history, relationships, or known health conditions
In most cases, coverage of liability insurance, travel, supplies, or continuing education
Per diem rates are useful when you are pricing event coverage. They are not the right number to bring to a salary negotiation for an ongoing role. Used in the wrong context, they make it harder for an AT to defend their compensation, not easier.
Where ATvantage Falls in Comparison
Our 2025/2026 pay scale for ongoing AT roles sits at $34 to $40 per hour. That places ATvantage at or above the upper end of the FT equivalent ranges we collected across every region in this report, with the exception of Los Angeles, where the ceiling on outlier roles can run higher.
We do not benchmark to the floor. We benchmark to NATA, to BLS, to the regional data we collect month over month, and to what the work is actually worth.
The Bottom Line
This analysis reflects ongoing employment compensation only. Per diem data has been intentionally separated to prevent distortion.
California is high-paying, but not uniquely the highest in the US.
Arizona and Pittsburgh remain cost-effective markets. California and Philadelphia require higher ranges to remain competitive.
The data continues to support a tiered, region-specific compensation strategy rather than a single national rate.
We publish this every year because the profession deserves transparency. Athletic Trainers should not have to piece together fragmented salary data from job boards and message boards to figure out what fair pay looks like in their region. That is on the rest of us.
If you are an AT navigating a job search, a contract renewal, or a conversation about your own pay this year, take this with you. And if you want to compare year over year, our 2023 and 2024 market research blogs are still up.
*Where appropriate, a total of 2,080 hours per year is used to determine the hourly rate of annual salaries. This is a well-documented total calculated by multiplying 40 hours/week by 52 weeks. Despite most ATs working more than 40 hours per week or fewer than 52 weeks, we use a standardized average to stay consistent with standardized data.
Sources: